Tags
I’ve not blogged about the anti Hs2 campaign for some time, mainly because their campaign’s collapsed. There’s nothing going on nationally, just a dwindling number of folk moaning about Hs2 on Twitter. Locally, a few campaign groups on Phase 2 continue to make a noise, but their numbers are small and there’s little in the way of co-ordination.
However, last Thursday, Joe Rukin of the sole surviving ‘national’ group (Stop Hs2) decided to start yet another anti Hs2 petition using the Governments template. What a bad idea! I’ve always said that (like social media), these petitions are a double-edged sword. They’re just as likely to show a campaign’s weaknesses as much as its strengths – as is the case here. Regular readers will know I love this petition format as it provided some very interesting numbers to crunch. Signatories are identified by constituency and a total is given as a percentage of resident constituents. So, this morning I crunched the numbers. The petition will run until March 2018, which means Stophs2 have 6 months of embarrassment to come (if they last that long).
Here’s a link to the petition itself. 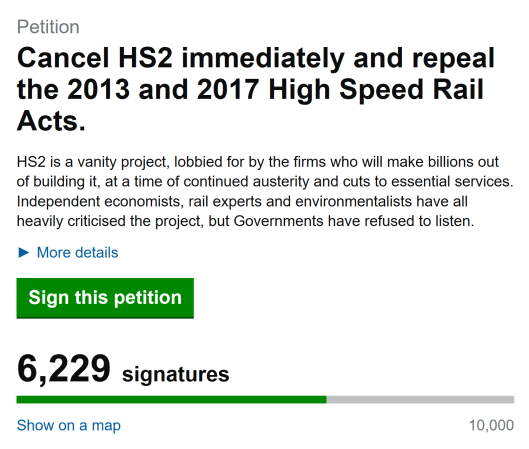
The map that comes with the petition’s the really useful resource as it highlights the constituents with the largest number of signs using different colours. The darker the colour, the more who’ve signed. Now, spot where Hs2 goes!
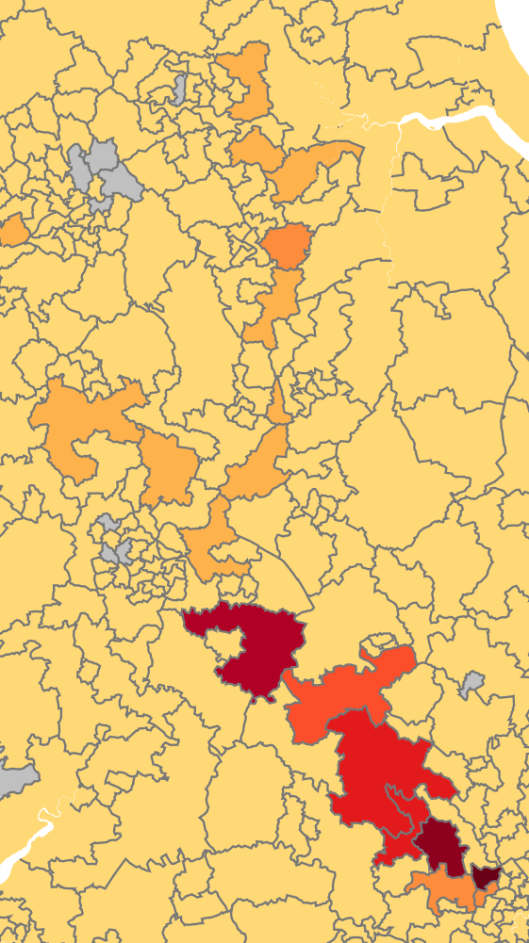
Straight away the map explodes the myth that the Stop Hs2 campaign’s national. It’s clear that it’s anything but. Folk signing the petition are mostly living on the route, with the greatest concentration on Phase 1 around the Chilterns!
Here’s the number crunching, firstly for constituencies on Hs2 Phase 1 – which is a done deal now.
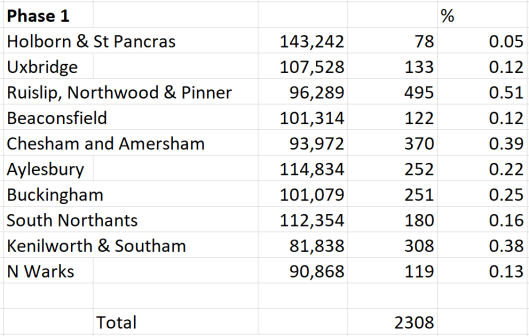
The first figure is the number of constituents, the second is the number who’ve signed the petition and the final one is the percentage of constituents. The first fact that leaps out is how tiny the percentages are, the largest is just over half 1%! The second fact is that phase 1 signatories make up a third of the grand total of 6229. The other fact is that other constituencies on the phase 1 route aren’t on the spreadsheet as the numbers of signatories are so small.
Now let’s have a look at Phase 2. I’ve divided them between the two legs of Hs2, Manchester and Leeds. Lets look at the Manchester route first.
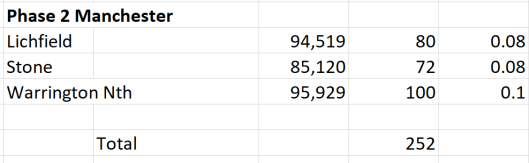
What’s fascinating about this is that so few constituencies Hs2 passes through feature. This proves what I’ve been saying for some time, the stop Hs2 campaign’s always been weak here (there’s never been a single anti Hs2 group in Manchester for example) but now it looks like it’s pretty much collapsed. Despite the presence of a small but noisy Mid-Cheshire ‘action’ group, Congleton constituency only has 25 signs. Stafford has 31.
Now let’s look at the Leeds leg.
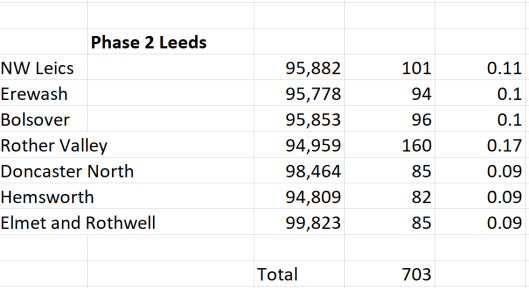
The numbers show that all the noise that’s come from one or two groups in Yorkshire and elsewhere hasn’t translated into signatures and the percentages for the constituencies are well below what we see on phase 1, which suggests there’s far less outrage about Hs2 here.
It’s worth remembering that these petitions get the greatest number of signs in the first few days. Once the activists have signed, numbers drop off rapidly. To reach it’s target the petition needs over 555 signs every single day for the duration. There’s no chance of that happening. This petition’s utterly pointless. The only thing it’s doing is allowing people to monitor the pulse of the stophs2 ‘campaign’. Judging by these numbers, it won’t be long before someone turns off its life-support machine. I’ll report back monthly, just to monitor what happens.