
Tags
Yesterday the ORR released the latest rail passenger statistics and (yet again) the numbers hit new records.
The statistics relate to Quarter 4 (1 January 2015 to 31 March 2015) & show that over 1.6 billion passenger journeys were made, the highest recorded figure since the series of statistics began in 2002-03. In fact, passenger growth has been continuous for every year (bar 1) since 1992, as this chart shows.
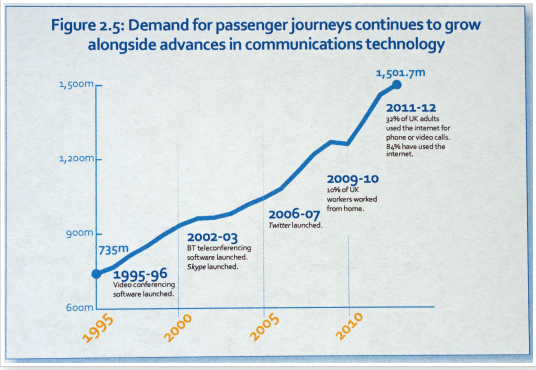
Mind you, the chart also exposes another of the anti Hs2 campaigns claims – that the internet, home working & teleconferencing et al will make Hs2 redundant.
Looking at the latest figures in detail it’s clear that passenger growth is across the board. What’s interesting is the way that both Long Distance (LD) and regional services are growing faster than London & the South East. Long Distance growth is the area Hs2 antis always try & focus on to the exclusion of all else, so the figures for LD will particularly hurt them.
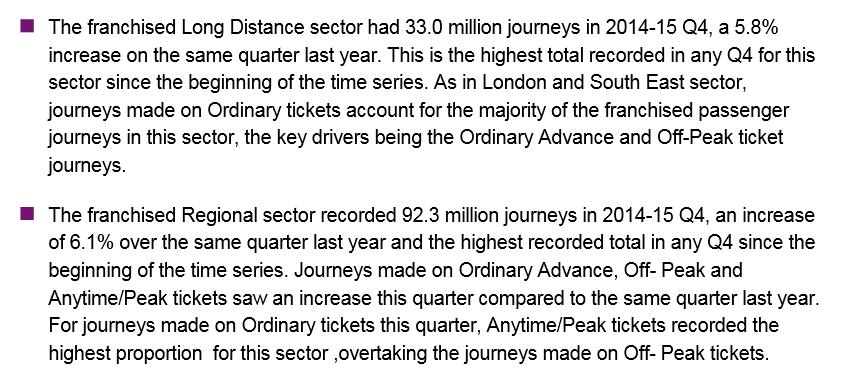
Remember that 5.8% is 3.8% higher than the 2% growth projections used to justify the Hs2 business case. What’s also significant is the very strong regional growth of 6.1% which is the largest quarters growth ever recorded by these stats.
Those regional services use many of the major hub stations like Leeds, Manchester Piccadilly, Birmingham New St & Sheffield that Hs2 will free up capacity at. If we want to grow regional services we’re going to need to add capacity to them – which is exactly what Hs2 does.
Another sector that has registered very strong growth (9%) is the long-distance open access operators like Grand Central & Hull Trains.
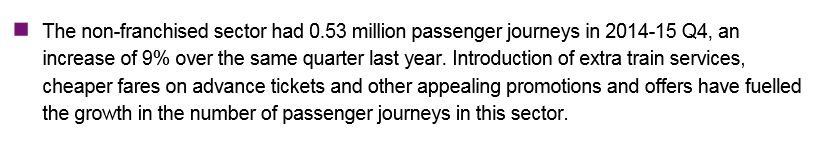
OA operators often struggle to get paths due to a lack of capacity on the East & West coast main lines. Yet clearly, there’s a demand for their services. There’s an obvious argument to allow them to grow (at little risk to the public purse) but there’s little chance of this happening without Hs2 creating capacity.
Contrast these record passenger numbers with the utterly bonkers beliefs of Hs2 antis – like this..

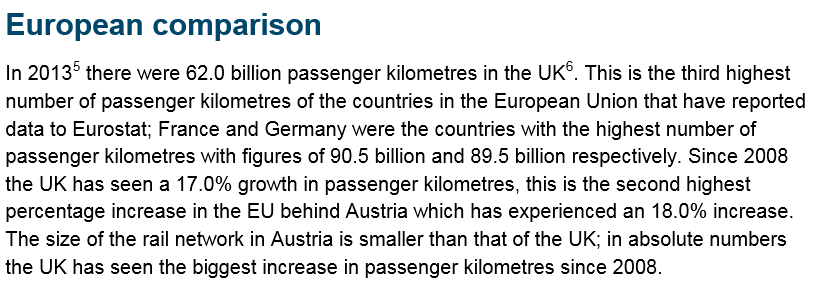
Meanwhile, on another front, let’s have a look at how UK passenger growth compares with the rest of the EU.
And..
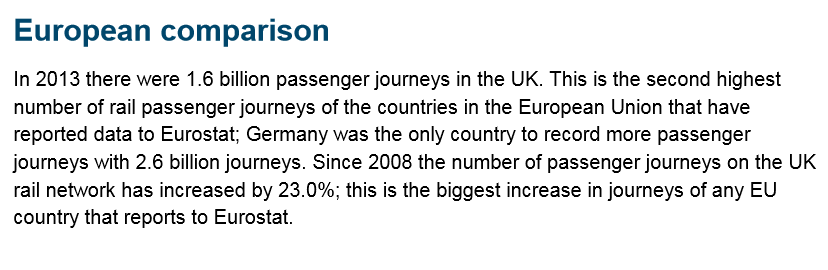
Clearly, the majority of EU countries would give their eye teeth for the level of growth that’s being experienced in the UK!
Finally, let’s have a look at some long-term trends. This is a chart showing the growth in passenger Kms (The number of kilometres traveled by passengers on the network) across all sectors between 2002 & the present day.
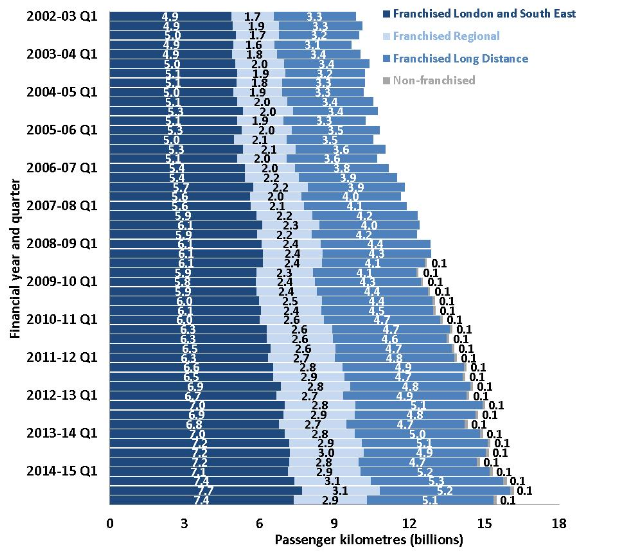
From this it’s clear that not only has growth been continuous, but that it’s also accelerating.
Despite all the evidence some still try & pretend we don’t need High Speed 2s capacity for the future. Is it any wonder their campaign has failed?
UPDATE:
Within a few minutes of the blog appearing, Bury based PR Nigel Sarbutts has responded on Twitter to provide a wonderful example of both the levels of intellectual bankruptcy & self delusion of the anti Hs2 campaign – not to mention why the world of PR has a reputation for a very uneasy relationship with truthfulness!
His tweets?

The claim that fluctuations between quarters in a year is actually a ‘fall’ is as intellectually bankrupt as you can get. Not to mention that fact they’re all still growth one only has to look at the yearly averages for the following years and it’s blindingly obvious that the growth in passenger KMs is accelerating
2011-12. Average 4.7
2012-13. Average 4.87
2013-14. Average 4.92
2014-15. Average 5.2
But not to an anti in denial of course!

Still, I should thank Sarbutts for handing me such a fine example of the anti Hs2 campaigns deceit & denial on a plate. Look how he’s changed the wording on his later claims..

One would expect that a genuine professional & person of integrity would be ashamed to be caught so blatantly twisting the truth. Draw your own conclusions that they’re not…

So what’s that last line? Jan-March 2015 if I’ve read that right? A post Christmas dip? Shocking. Who would expect that people might tighten their belts and travel less as the financial year ends. And oh look, it happened in the same period in 2013-14. And 2012-2013. And 2004-2005 for that matter… And what happened after in each case…
Yeah, trends can be very interesting when people bother to look at them properly.
Indeed they can. What’s laughable about Hs2 antis like Sarbutts is that they think they can get away with insulting people’s intelligence with such obvious attempts at deceit. But it does explain why their campaign’s been such an abject failure.
What beggars belief is why someone from Bury/Manchetser would be anti HS2? What skin is it off his nose?
http://www.checkcompany.co.uk/director/701736/MR-NIGEL-WILLIAM-SARBUTTS
If rail usage is going to continue growing then there would be an argument to look at the whole network and decide how it might be improved most efficiently and effectively to cater for some elements of that growth. High speed lines are ridiculously expensive, controversial, take years to deliver and benefit so few. Longer trains, electrification, better signalling, some modest works to improve train operation (e.g. higher speed points, passing loops, grade-separation), and last, but not least, creating a truly integrated network, could deliver much greater capacity and benefit far more people, far more quickly, at less cost, and have the flexibility to adapt to changing circumstances. Throwing £60-70 billion (or more allowing for inflation) at one scheme, HS2, in the hope that it will deliver some benefits sometime in the 2030s to a few people travelling between a handful of large cities makes no sense whatsoever. Needless to say I don’t expect you to agree with that argument and I don’t expect you will post this. Perhaps in twenty years, you might realise where we went wrong, but by then it will be too late and future generations will have an expensive albatross around their necks.
I’d always agree on an overall view, so it’s a good job we have one. Great Western mainline is undergoing a massive amounts of work. South West Trains are upgrading and lengthening their trains – and platforms. There’s electrification and longer trains on the Liverpool-Manchester route, there’s the re-opening of the Borders railway in the Scottish Borders, plans to improve journey times to East Anglia. Oh and the re-opening of the Todermorden Curve, the massive work Chiltern are doing and so much more that I can’t even remember off the top of my head.
There are times however when upgrades can only do so much. It’s not that long ago that a massive upgrade of the West Coast Mainline happened. It cost billions, caused huge amounts of disruption, caused some local stations serving small villages to be closed permanently and it simply wasn’t enough to provide the demand. It was a sticking plaster solution, and there’s only so much sticking plasters can do.
I’m happy to publish this because it’s a very good illustration of why the anti Hs2 campaign’s failed. It shows that – despite more than 10 years of discussions, research papers & strategic reviews on the needs of a future railway & the alternatives to Hs2, the anti hs2 mob have managed to keep their heads stuck firmly in the sand.
“Longer trains, electrification, better signalling, some modest works to improve train operation (e.g. higher speed points, passing loops, grade-separation)” you say?
All these things have been discussed ad-nauseum. I’ve talked about many of them in this blog. The truth is – many of them are unworkable & none of them offer the advantages that Hs2 can. Yet you still trot out the same failed arguments because that’s all you’ve got. That’s been one of the great weaknesses of the anti Hs2 campaign. You start off with the answer “we don’t need Hs2” then try and make the facts fit around that premise. Your problem is they don’t but you won’t believe anyone who points that out. So you’re stuffed.
Meanwhile,in the real world, the argument moved on years ago. Parliament passed the Hs2 Hybrid Bill with a massive majority back in 2014. At that point your argument was already lost. The results of this May’s election banged the final nail into your coffin. You might not move on but everyone else has. The time for silly arguments over ‘alternatives’ to Hs2 is long past. In 2016 the enabling works will start & in 2017 construction proper will begin.
The anti Hs2 campaign’s finished & it’s time you got used to that idea.
I’m sorry to say that I I don’t believe the figures you quote actually support the case for HS2, probably the reverse.
You point out that the figures show an increasing demand for rail travel across the board. Or in other words, that more and more people are wanting to go from everywhere to everywhere else.
But nowhere in the figures does it show that people want to get there more quickly. In fact because the figures show that the main growth is in the lower price region there is an argument that people want to pay less for their rail journeys, not more. There is nothing in those figures to indicate that people want significantly faster journeys.
But that part is speed-neutral. It doesn’t support, or go against, increased speed. However that’s not the reason why those figures really look to be against HS2.
What the figures show is what you say, that people want to get from lots of different places to lots of other different places. It’s across the board. And that is the one thing which HS2 simply doesn’t, and cannot, do. Looking at phase 1: the current train links between London and Birmingham include stopping at major conurbations such as Watford, Northampton, Milton Keynes and Coventry; picking up passengers from these places and their catchment areas linked by slow feeder trains. But HS2, because of its speed cannot do that. It cannot stop and start and maintain speed. It can only go non-stop from London to Birmingham (actually 2 stops & slow between them)
What the figures show is that there is a need for increased capacity across the board i.e. an increased capacity mass transit rail system. Solving it for just two points and two journeys is not a solution. It needs to solved for dozens of points and hundreds of permutations of journeys. In fact, because HS2 (phase 1) is such a very small part of the solution it makes things by absorbing the money which could be spent on the rest of the rail system. Which delays solving the rest of the problem. Phase 2 may improve things – but that assumes that the only journeys people want in the north are Manchester – Brum & Leeds – Brum. And not Manchester – Leeds. And of course not to any of the other conurbations in the north.
The country deserves better.
I look forward to your comments. (btw: I agree that it’s probably too late to stop HS2, but one should always try to explain mistaken thinking as it may help prevent repeat errors.)
As usual, those opposed to Hs2 fundamentally fail to understand the issues around rail capacity & how railways work. You say that..
“Looking at phase 1: the current train links between London and Birmingham include stopping at major conurbations such as Watford, Northampton, Milton Keynes and Coventry; picking up passengers from these places and their catchment areas linked by slow feeder trains. But HS2, because of its speed cannot do that. It cannot stop and start and maintain speed. It can only go non-stop from London to Birmingham (actually 2 stops & slow between them)”
Of course Hs2 can’t do that. It’s not designed to. Just as existing LD Intercity trains don’t. Many trains from Euston are first stop Crewe or Warrington (& Kings Cross are York). The point of Hs2 is to take those long distance non-stop trains OFF the existing network to free up capacity for new services to stop at the stations you mention.
As for the need for an “increased capacity mass transit rail system” – that’s exactly what Hs2 is between many of out major cities, the places where much of the population lives and works.
Hs2 is not “absorbing the money which could be spent on the rest of the rail system”. Let’s be clear about that. It’s funded separately from different sources & there’s no evidence that if we didn’t build hs2 the money would be diverted to the existing network. There’s also the matter that huge regeneration schemes are riding on the back of Hs2.They’re happening at Euston, Old Oak Common, Birmingham, Leeds, Manchester airport and Manchester. In the fullness of time they’ll also happen at Toton & Meadowhall. None of these schemes would happen on the back of investment in the existing network.
Hs2 is far more than just a new railway.